Laravel Nightwatch: Production Monitoring Built for the Laravel Ecosystem
Laravel Nightwatch delivers production-grade observability for Laravel apps with zero-config setup, deep telemetry, and real-time alerting.
When something goes wrong in production, the difference between a five-minute fix and a three-hour debugging session is almost always visibility. You either know what your application was doing at the moment it broke, or you do not. Laravel has had tools for local debugging (Telescope) and lightweight production metrics (Pulse) for a while now, but neither of them was designed to be a full production observability platform. That is exactly what Laravel Nightwatch is.
Nightwatch is the official Laravel monitoring service, purpose-built for Laravel applications deployed anywhere. It captures the full execution context of requests, jobs, commands, and scheduled tasks, streaming billions of events per day into a queryable dashboard with sub-second latency. If you run Laravel in production and you care about knowing what your application is actually doing, Nightwatch is worth understanding.
What Nightwatch Monitors
The scope is wide. Nightwatch covers every part of your application’s execution lifecycle:
- HTTP Requests: Full request context, including related queries, jobs dispatched, outbound HTTP calls, and exceptions thrown during that request.
- Database Queries: Query text, bindings, execution time, and which request or job triggered them.
- Queued Jobs: Execution time, retry count, and failure details with full stack traces.
- Exceptions: Exception class, message, throw site with source context, and occurrence count.
- Outgoing HTTP: Requests your application makes to external services, with timing and status codes.
- Cache: Hit/miss rates, key-level storage patterns, and invalidation events.
- Commands: Artisan command execution with timing and output.
- Scheduled Tasks: Whether your scheduler is running on time and whether tasks are completing successfully.
This is not a sample of your traffic. Nightwatch captures every event, which is what makes it genuinely useful for tracking down issues that only affect a small percentage of requests.
Zero-Config Setup
Installation is intentionally frictionless:
composer require laravel/nightwatchThen publish the config file and set your token:
php artisan vendor:publish --tag=nightwatch-configAdd the token to your environment:
NIGHTWATCH_TOKEN=your-token-hereRedeploy and events start flowing. There is no agent to install separately, no changes to your application bootstrap, and no instrumentation code to add to controllers or jobs. Nightwatch hooks into Laravel’s internal event system, which is why it can be zero-config: the framework already emits the right events at the right times.
If you want to capture request payloads for debugging (useful when an exception’s context depends on the input), you can opt in explicitly:
NIGHTWATCH_CAPTURE_REQUEST_PAYLOAD=trueThis is off by default because request payloads can contain sensitive data. Turn it on when you need it, know what you are capturing, and consider rotating it off once you have the debug information you need.
Custom Alerts
One of Nightwatch’s practical strengths is threshold-based alerting. Rather than wading through dashboards looking for problems, you define what “acceptable” looks like for your application and Nightwatch tells you when you fall outside it.
You can define thresholds on response time, error rates, job failure rates, query durations, and cache hit rates. When a threshold is breached, Nightwatch surfaces it in the dashboard and can notify your team through configured integrations. This moves monitoring from a reactive “something broke, go look” workflow to a proactive “this metric crossed a line, investigate before users notice” pattern.
Nightwatch vs Telescope vs Pulse
If you already use Telescope or Pulse, you might wonder whether Nightwatch replaces them. The honest answer is: it depends on what you are optimizing for.
Telescope is a local debugging tool. It stores every request, query, job, and notification in your local database, giving you a detailed log of what happened during development. It is not suitable for production at scale because it writes to your application database synchronously, which creates overhead and volume issues.
Pulse is designed for production, but it is a metrics aggregation tool, not an event-level observability platform. Pulse shows you aggregate throughput and slow queries over time. It does not let you drill into a specific failing request from Tuesday at 2:47 AM and see every query it ran.
Nightwatch is the production counterpart to Telescope’s local experience. You get Telescope-style depth (individual events, full context, timeline views) but designed to run at production scale, across all your servers, without touching your application database. The official comparison pages are worth reading if you want the full breakdown.
The Architecture Behind It
What makes Nightwatch able to handle the volume without degrading your application is its architecture. Instead of writing to your database, the Nightwatch agent ships events asynchronously to Nightwatch’s infrastructure, which runs on a dual-database stack: Amazon RDS for PostgreSQL handles transactional workloads (account data, configuration), and ClickHouse Cloud handles the analytical queries against event data. ClickHouse is a columnar database built for exactly this kind of workload: high-ingest, high-cardinality, time-series data that needs fast aggregation queries.
The result is that queries against billions of events stay fast, the dashboard feels responsive, and your application does not bear the cost of storing its own observability data.
Real-World Validation
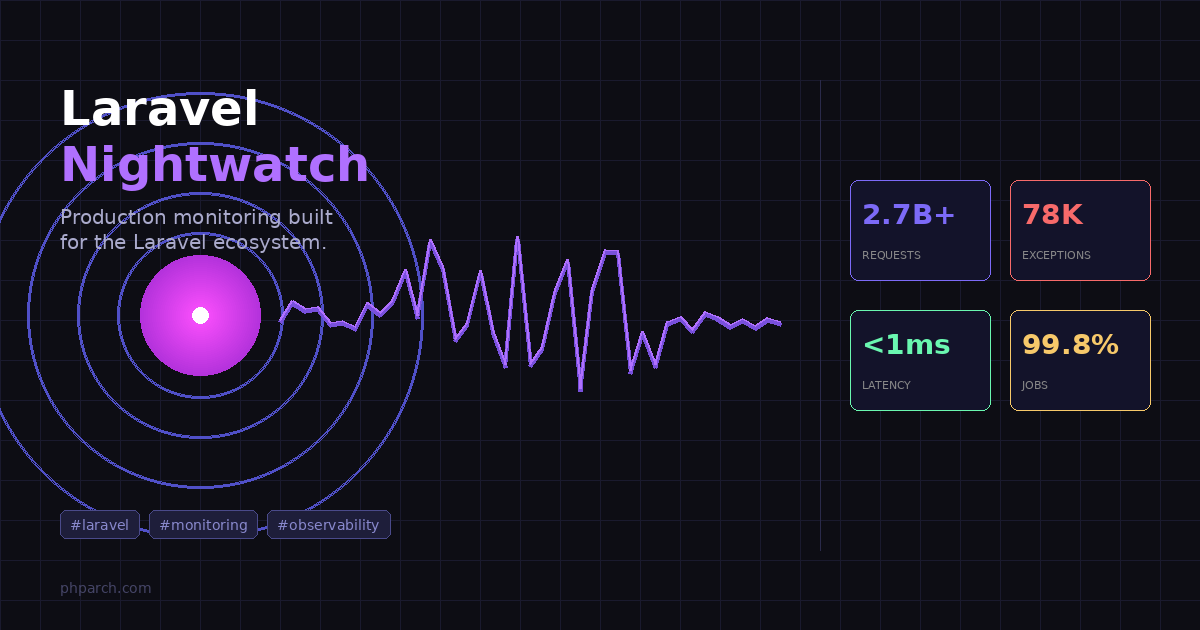
Shortly after launching, the Nightwatch team ran it against Laravel Forge’s production traffic. In 2.7 billion events, it surfaced 78,000 exceptions that had not been explicitly caught or reported elsewhere. Some of those were noise; some were legitimate issues affecting real users. The point is that without Nightwatch, there was no easy way to know they were happening.
That story is a good illustration of what production observability is actually for. It is not just about debugging things you know are broken. It is about discovering things you did not know were broken, before your users make a support ticket about them.
Getting the Most Out of It
A few things worth configuring once you have Nightwatch installed:
Set up alert thresholds early, before you need them. Configuring a 200ms response time alert is much more useful before a deployment that introduces a slow query than after.
Review your exception list regularly, not just when something is actively on fire. Exceptions that occur at low frequency are easy to miss in logs but easy to spot in Nightwatch’s aggregated exception view.
Use the request timeline view when debugging. If a request is slow, the timeline shows you exactly which middleware, controller actions, and queries contributed to the response time. The bottleneck is usually obvious once you can see the sequence.
Be intentional about payload capture. Enabling NIGHTWATCH_CAPTURE_REQUEST_PAYLOAD is powerful for debugging but make sure you understand what data flows through your endpoints before turning it on in a regulated environment.
Pricing
Nightwatch offers a free tier, along with Pro, Team, and Business plans priced by event volume. For most smaller applications on the free tier, the observability you get is a significant improvement over flying blind. Production teams with meaningful traffic will likely land on a paid plan, but the pricing is structured around what you actually use rather than a flat seat fee. Details are at nightwatch.laravel.com/pricing.
Wrapping Up
Production monitoring used to require either expensive third-party APM tools (New Relic, Datadog) or accepting that you would only find out about problems when users reported them. Nightwatch changes that equation for Laravel developers specifically. It is tightly integrated with how Laravel actually works, it is zero-config to start, and it scales to real production workloads without putting that load on your application database.
If you are running Laravel in production today without something like Nightwatch, you are operating with incomplete information. The setup takes less than ten minutes. The value shows up the first time you catch something before a user does.
Sources
- Laravel Nightwatch Official Site
- Announcing Laravel Nightwatch - Laravel Blog
- Nightwatch Found 78K Exceptions in 2.7B Events on Forge - Laravel Blog
- How Laravel Nightwatch handles billions of observability events - AWS Big Data Blog
- Laravel Nightwatch vs Laravel Pulse
- Laravel Nightwatch vs Laravel Telescope
- Laravel Nightwatch: Deep Dive into Laravel’s Official Production Monitoring Tool