Step Debugging PHP in NeoVim: nvim-dap and Xdebug, Done Right
A practical guide to wiring up nvim-dap with Xdebug 3 so you can set breakpoints and step through PHP code without ever leaving NeoVim.
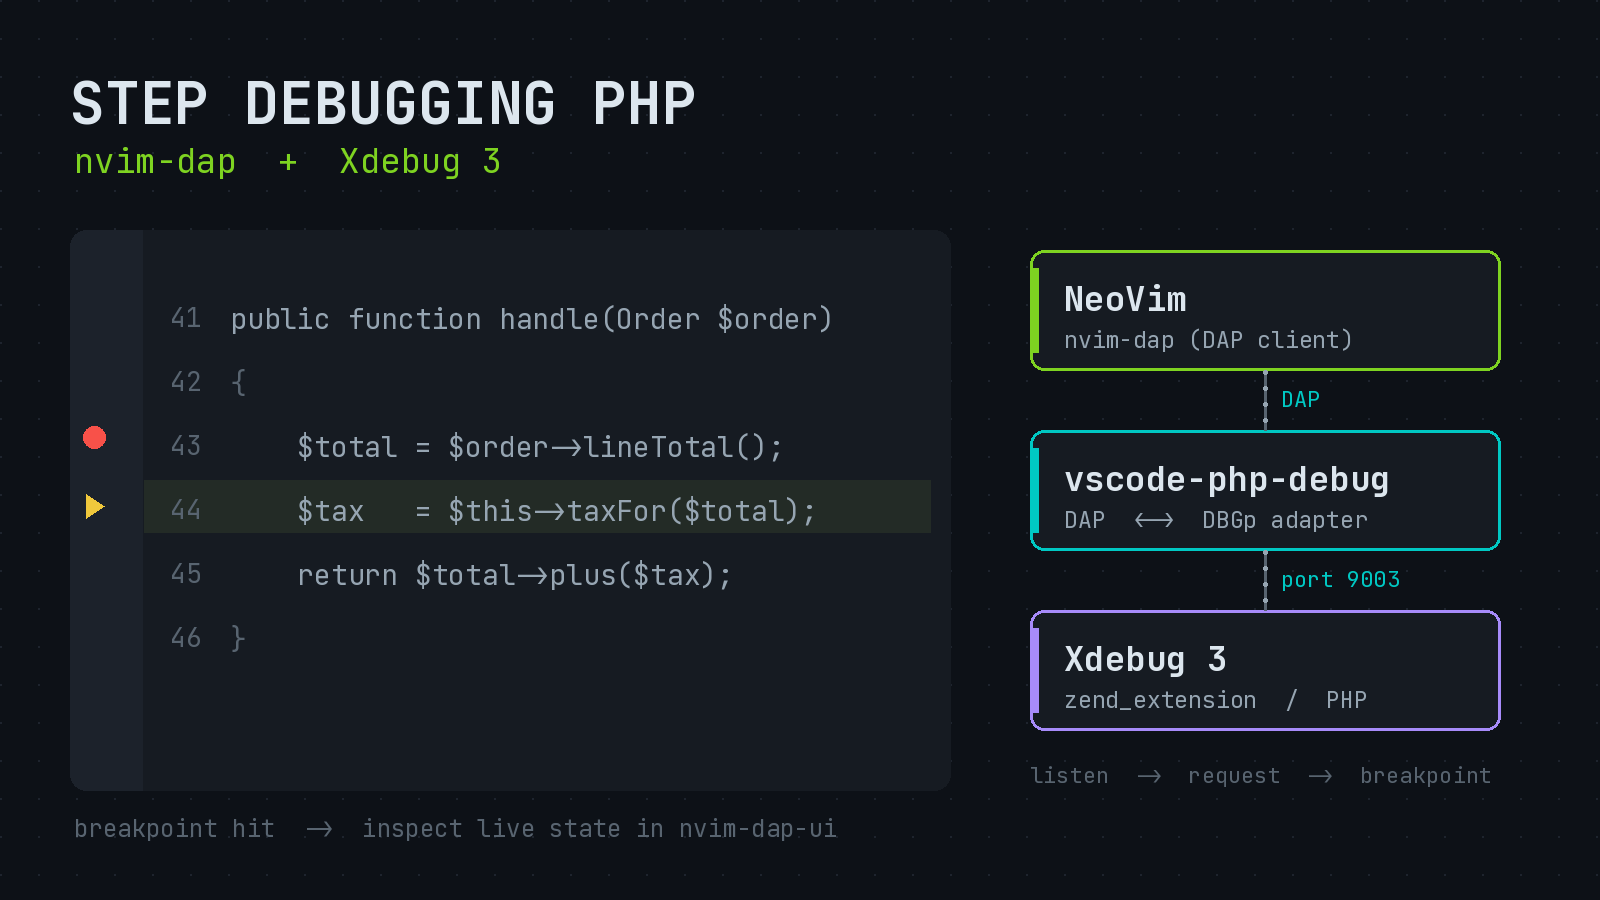
If you have moved your PHP development into NeoVim, the one thing you probably miss from a full IDE is the debugger. Completion and LSP get all the attention, but the ability to set a breakpoint, hit a request, and inspect the actual state of your application is what separates guessing from knowing. The good news is that NeoVim has a mature Debug Adapter Protocol client, and getting it to talk to Xdebug is far less painful than the scattered blog posts of a few years ago would suggest. This is the setup I run every day, and it has not meaningfully changed in 2026.
The Two Halves of the Problem
Debugging PHP in any editor involves two separate pieces, and confusing them is the source of most frustration. The first piece is Xdebug itself, the PHP extension that pauses your script and speaks the DBGp protocol over a socket. The second piece is a Debug Adapter Protocol (DAP) client, which is what NeoVim provides through the nvim-dap plugin. Those two protocols do not speak the same language, so you need a translator in the middle. That translator is vscode-php-debug, the same adapter VS Code uses under the hood. NeoVim talks DAP to the adapter, and the adapter talks DBGp to Xdebug.
Once you see it as those three layers, the configuration stops feeling like magic.
Setting Up Xdebug
Start on the PHP side, because if Xdebug is not configured correctly, nothing downstream matters. Xdebug 3 changed the configuration keys from the 2.x days, and this is the single most common reason an old tutorial fails you. The port also changed from 9000 to 9003, which matters because 9000 collides with PHP-FPM on a lot of machines.
Add this to your php.ini or a dedicated xdebug.ini:
zend_extension=xdebug

xdebug.mode=debug
xdebug.start_with_request=yes
xdebug.client_host=127.0.0.1
xdebug.client_port=9003
The start_with_request=yes setting tells Xdebug to attempt a connection on every request. That is convenient for local development. If you find it too aggressive, set it to trigger and use a browser extension or an environment variable to start sessions on demand. Confirm the extension loaded with php -v, which should mention Xdebug in the output.
Installing the Plugins
On the NeoVim side you need three things: nvim-dap for the core client, nvim-dap-ui for a usable interface with variable and call-stack panes, and the adapter binary. The cleanest way to get the adapter is through Mason, which packages it as php-debug-adapter and handles the build for you.
With lazy.nvim, a minimal spec looks like this:
{
  "mfussenegger/nvim-dap",
  dependencies = {
    "rcarriga/nvim-dap-ui",
    "nvim-neotest/nvim-nio",
    "williamboman/mason.nvim",
  },
  config = function()
    local dap = require("dap")
    local dapui = require("dapui")
    dapui.setup()

    -- Open and close the UI automatically.
    dap.listeners.before.attach.dapui_config = function() dapui.open() end
    dap.listeners.before.launch.dapui_config = function() dapui.open() end
    dap.listeners.before.event_terminated.dapui_config = function() dapui.close() end
    dap.listeners.before.event_exited.dapui_config = function() dapui.close() end
  end,
}
After installing, run :MasonInstall php-debug-adapter once. Mason drops the adapter into its packages directory, which keeps the path predictable across machines.
Wiring the Adapter to Xdebug
This is the part that does the translating. Inside the config function above, register the PHP adapter and a launch configuration:
dap.adapters.php = {
  type = "executable",
  command = "node",
  args = {
    vim.fn.stdpath("data")
      .. "/mason/packages/php-debug-adapter/extension/out/phpDebug.js",
  },
}

dap.configurations.php = {
  {
    type = "php",
    request = "launch",
    name = "Listen for Xdebug",
    port = 9003,
  },
}
The name “Listen for Xdebug” is slightly misleading. With request = "launch", the adapter opens a listening socket on port 9003 and waits for Xdebug to connect to it. That is exactly what you want for web requests: you start the listener in NeoVim, then trigger a request in the browser or with curl, and Xdebug calls back. The port here must match xdebug.client_port.
Keybindings That Make It Usable
A debugger you cannot drive quickly is a debugger you will not use. These are the mappings I consider non-negotiable:
local dap = require("dap")
vim.keymap.set("n", "<F5>", dap.continue)
vim.keymap.set("n", "<F10>", dap.step_over)
vim.keymap.set("n", "<F11>", dap.step_into)
vim.keymap.set("n", "<F12>", dap.step_out)
vim.keymap.set("n", "<Leader>b", dap.toggle_breakpoint)
vim.keymap.set("n", "<Leader>dr", dap.repl.open)
The function keys mirror what most IDEs use, which keeps your muscle memory portable. <Leader>b toggles a breakpoint on the current line, and that is where you will spend most of your time.
A Real Debugging Session
Here is the full loop. Open the PHP file you want to inspect and drop a breakpoint with <Leader>b. Press <F5> to start the listener, and nvim-dap-ui opens its panels. Now hit your application: load the page in a browser, or run something like curl http://localhost:8000/orders/42. Xdebug connects back to the listener, your script pauses on the breakpoint, and the UI fills with the current scope. You can hover variables, expand objects in the side pane, step through line by line, and drop into the REPL to evaluate arbitrary expressions against the live state. When the request finishes, the UI closes itself.
For CLI scripts and test runs the flow is identical, because start_with_request=yes makes Xdebug attempt the connection regardless of how PHP was invoked. Start the listener first, then run php artisan something or your Pest suite, and breakpoints in that code path will fire.
Debugging Inside Docker
If your PHP runs in a container, the only extra piece is path mapping, because the file paths Xdebug reports from inside the container will not match the paths on your host. Add a pathMappings table to the configuration that maps the container path to your local project root:
{
  type = "php",
  request = "launch",
  name = "Listen for Xdebug (Docker)",
  port = 9003,
  pathMappings = {
    ["/var/www/html"] = "${workspaceFolder}",
  },
}
Inside the container, point xdebug.client_host at your host machine. On Docker Desktop that is host.docker.internal; on a native Linux setup you will typically use the gateway address or host-gateway. Get the mapping right and breakpoints in containerized code behave exactly like local ones.
Worth the Ten Minutes
The setup is a handful of lines, and once it is in your config it is done. Trading dump and die for real breakpoints changes how you read unfamiliar code, and it keeps you in the editor you already live in. If you have been putting this off because the old guides were a mess of Xdebug 2 ports and hand-built adapters, the modern Mason-based path is genuinely simple. Spend the ten minutes.